 NLJUG – Nederlandse Java User Group NLJUG – de Nederlandse Java User Group – is opgericht in 2003. De NLJUG verenigt software ontwikkelaars, architecten, ICT managers, studenten, new media developers en haar businesspartners met algemene interesse in alle aspecten van Java Technology.
Author: Angelo Rubini
Original post on Foojay: Read More
Table of Contents
Profiling a Java Application Running Inside an Unikernel with JProfiler
Unikernels are often associated with minimalism and tight resource control.
But can we profile a Java application running inside a unikernel using a standard JVM profiler?
The answer is yes.
In this guide, we will walk step by step through profiling a Quarkus
application running inside a Nanos unikernel using JProfiler and
IBM Semeru JRE 25 (OpenJ9).
No special hacks. Just standard JVM tooling.
Prerequisites
- Ops (https://ops.city/)
- JProfiler (https://www.ej-technologies.com/jprofiler)
- A Quarkus application packaged as a runnable JAR
1. Project Structure
We start from a clean Proof of Concept directory:
quarkusProfiling$ ls
config.json  jprofiler15  myQuarkusApp  tmp
Directory breakdown:
config.json→ Ops/Nanos configuration filejprofiler15/→ extracted JProfiler distributionmyQuarkusApp/→ packaged Quarkus runnable JARtmp/→ writable directory inside the unikernel
2. Ops Nanos Configuration
Below is the complete config.json used for this setup:
{
    "Version": "1.0.0",
    "Dirs":["myQuarkusApp","jprofiler15","tmp"],
    "Args": [
        "-agentpath:/jprofiler15/bin/linux-x64/libjprofilerti.so=port=8849,address=0.0.0.0",
        "-jar",
        "myQuarkusApp/quarkus-faces-runner.jar"
    ],
    "RunConfig": {
        "Ports": ["8080","8849"]
    },
    "BaseVolumeSz": "300m"
}
Explanation
Dirs
"Dirs":["myQuarkusApp","jprofiler15","tmp"]These directories are embedded into the unikernel filesystem:
- The application
- The JProfiler native agent
- A writable tmp directory
Args
"-agentpath:/jprofiler15/bin/linux-x64/libjprofilerti.so=port=8849,address=0.0.0.0"This is the key configuration.
We explicitly load the JProfiler native JVMTI agent at JVM startup.
Important parameters:
port=8849→ port used by the profileraddress=0.0.0.0→ listen on all interfaces
Then we launch the application:
"-jar", "myQuarkusApp/quarkus-faces-runner.jar"RunConfig
"Ports": ["8080","8849"]We expose:
8080→ Quarkus HTTP endpoint8849→ JProfiler agent port
BaseVolumeSz
"BaseVolumeSz": "300m"Allocates 300 MB for the unikernel filesystem.
3. Starting the Unikernel
From the project root directory, run:
ops pkg load AngeloRubens/SemeruJREx64Linux:25.0.1 --nightly -c config.jsonWhat this command does
- Loads IBM Semeru JRE 25 (OpenJ9)
- Applies our local
config.json - Embeds the application and profiler agent
- Boots the unikernel locally
There is no separate container or VM runtime.
The JVM runs directly inside the unikernel.
4. Boot Log Analysis
When the unikernel starts, you will see:
running local instance
booting /home/lop/.ops/images/java ...
[0.227374] en1: assigned 10.0.2.15
The unikernel has booted and received an IP address.
Then the JVM starts and the profiler agent initializes:
JProfiler> Protocol version 68
JProfiler> OpenJ9 JVMTI detected.
JProfiler> Java 25 detected.
JProfiler> 64-bit library
JProfiler> Listening on port: 8849.
This confirms:
- OpenJ9 JVM detected
- Java 25 runtime
- JVMTI available
- Native agent loaded successfully
Instrumentation Phase
JProfiler> Enabling native methods instrumentation.
JProfiler> Can retransform classes.
JProfiler> Native library initialized
JProfiler> VM initialized
This means:
- Class retransformation is supported
- Native methods can be instrumented
- The agent is fully integrated
Final State
JProfiler> Retransforming 11 base class files.
JProfiler> Base classes instrumented.
JProfiler> Waiting for a connection from the JProfiler GUI ...
JProfiler> Using address 0.0.0.0.
At this point:
- The JProfiler agent is listening on port 8849
- The JVM is waiting for a GUI connection
The profiling infrastructure inside the unikernel is fully operational.
5. Connecting JProfiler GUI
Open JProfiler.
- Click New Session
- Select Attach to remote JVM
- Enter:
- Host:
127.0.0.1 - Port:
8849
- Host:
- Connect
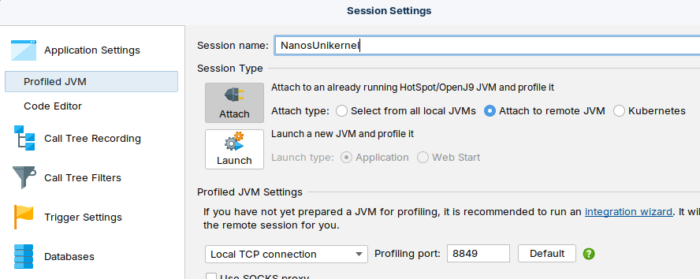
The GUI will attach to remote JVM running inside the unikernel(or connect to remote jvm running in you cloud provider or onprem).
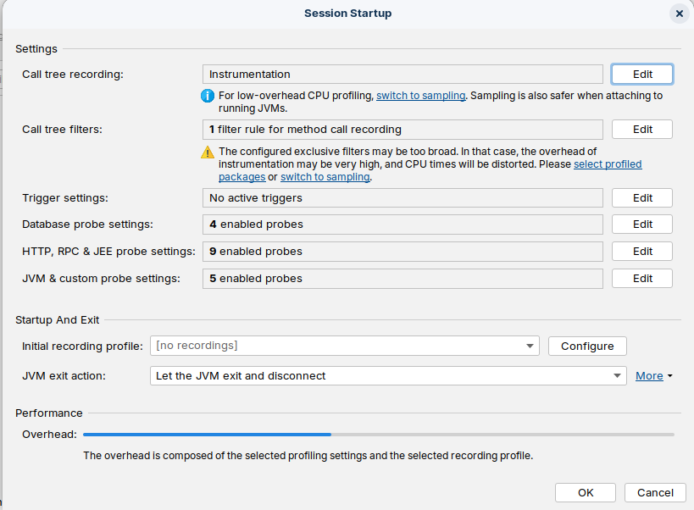
From here you can:
- Inspect CPU hotspots
- Analyze memory allocations
- Capture heap snapshots
- Monitor threads
- View GC activity
Exactly as you would with a standard JVM.
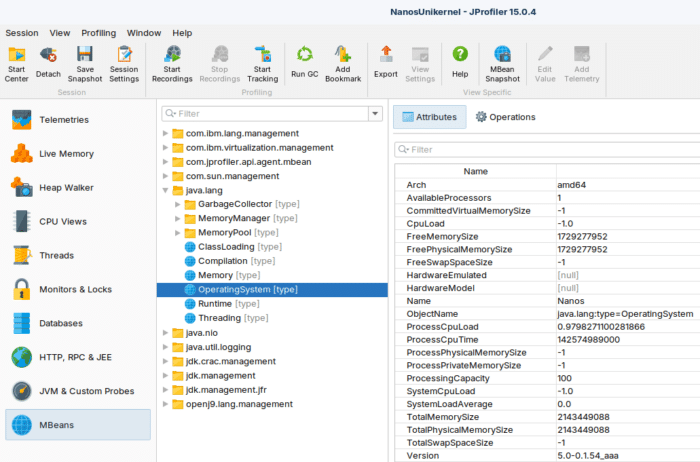
SO Info(Nanos name):
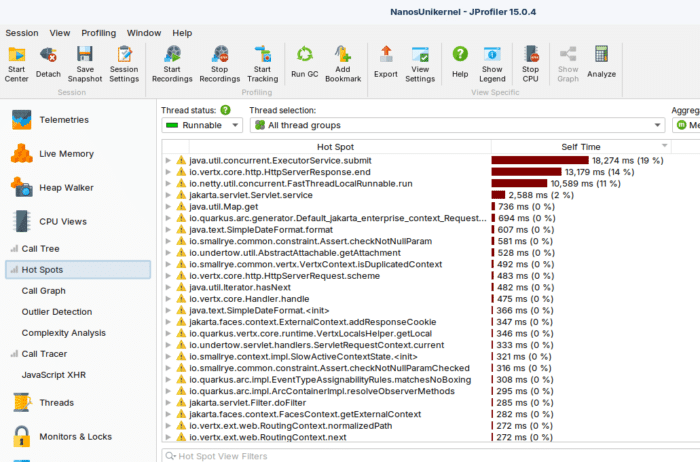
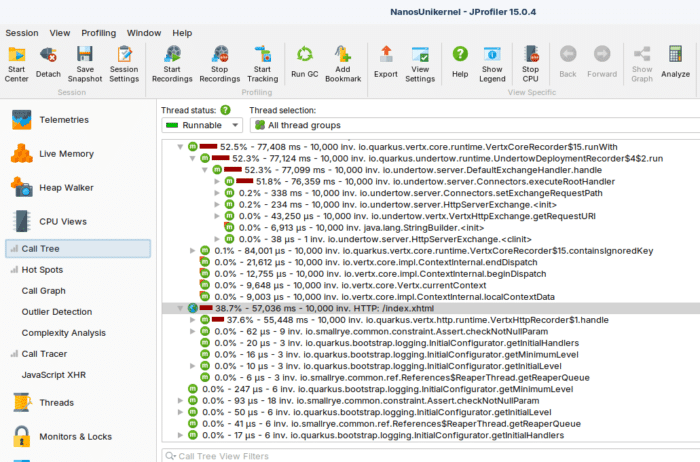
CPU Hot Spots
CPU Call Tree
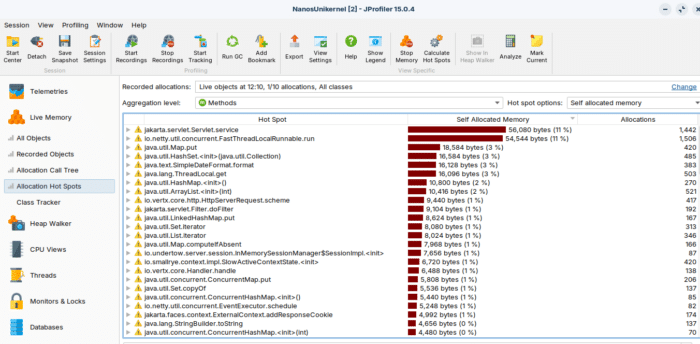
Live Objects
Why This Works
Unikernels do not remove JVM capabilities.
JProfiler uses:
- JVMTI
- Native agent loading via
-agentpath - Standard TCP communication
As long as:
- The agent library is available
- The port is exposed
- The JVM supports JVMTI
Profiling works.
The environment (VM, container, unikernel) does not change the JVM instrumentation model.
Conclusion
Profiling a Java application inside a unikernel is straightforward.
By:
- Embedding the profiler native agent
- Exposing the profiler port
- Using a standard JVM (IBM Semeru OpenJ9)
You can use JProfiler — or any JVMTI-based tool — without
limitations.
Unikernels do not prevent observability.
They simply run your JVM in a different execution model.
And from the JVM perspective, everything works exactly as expected.
If you want, yoou can see the sample app of this post, running into nanos Unikernel on Arm64 Ampere Oracle OCI Cloud http://80.225.94.232:8080/index.xhtml
The post Unikernel: Profiling and Troubleshooting JVM on Nanos Unikernel appeared first on foojay.